Chainlink (LINK) Poised for 22% Price Decline, Here’s Why
Amid the ongoing confusion in the cryptocurrency market, Chainlink’s native token LINK has shown bearish price action and is poised for a decline. However, the current market sentiment remains bearish, with top assets like Bitcoin (BTC), Ethereum (ETH), and XRP also experiencing notable price declines.
This downturn is potentially influencing overall market sentiment.
Chainlink (LINK) Technical Analysis and Upcoming Levels
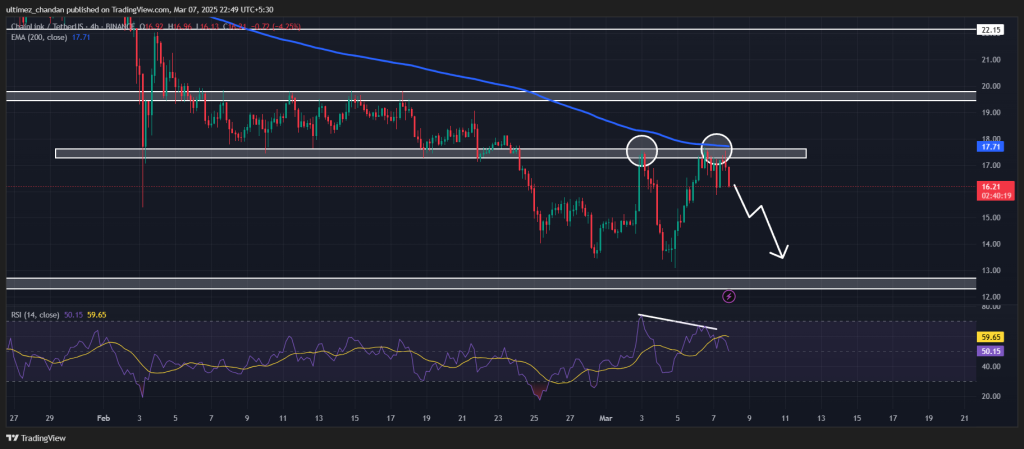
According to expert technical analysis, LINK appears to be forming a bearish double-top pattern on the four-hour timeframe. While this pattern is yet to be complete, the chart also shows a bearish divergence, further supporting this negative outlook.
Based on historical price momentum, if the asset closes below the $16.15 level, there is a strong possibility of a 22% decline, bringing it down to $12.75 in the coming days. A bearish divergence occurs when the Relative Strength Index (RSI) and the double-top pattern align, specifically when the pattern’s tops are parallel while the RSI’s tops decline.
Current Price Momentum
Following the formation of the pattern, the asset has begun moving downward. LINK is currently trading near $16.31 and has dropped 4.5% in the past 24 hours. Meanwhile, its trading volume has surged by 12%, indicating increased participation from traders and investors compared to the previous day.
- Also Read :
- Whale Pressure Drops as Ethereum Faces Sharp Decline: Here’s the Impact on ETH Price
- ,
Traders Lean Bearish
With the ongoing price decline and bearish price action, intraday traders seem to be following the current market sentiment, strongly betting on the bearish side, as reported by the on-chain analytics firm Coinglass.
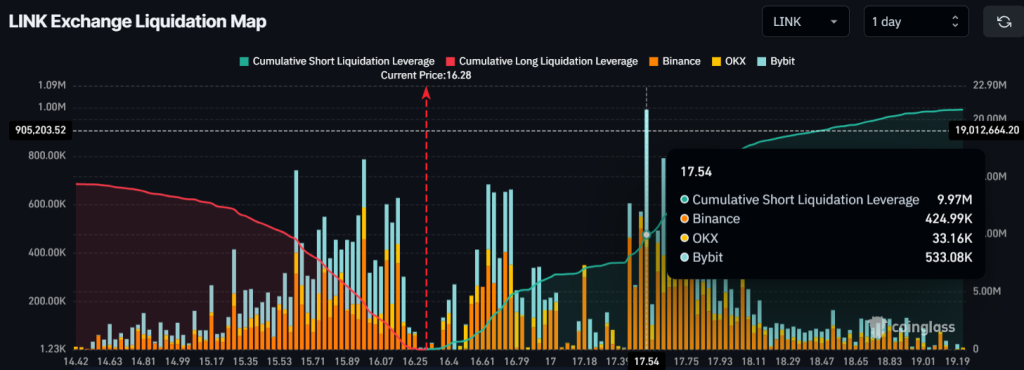
Data reveals that traders are currently over-leveraged, with key levels at $16 on the lower side and $17.50 on the upper side for both bulls and bears. At these levels, they have built $4 million worth of long positions and $10 million worth of short positions, indicating that bears are currently dominating and could push LINK’s price even lower.