Bitcoin (BTC) Tests Critical Support Amid Geopolitical Uncertainty—Will it Rebound to $105K or Drop to $102K?
Bitcoin price, after facing constant upward pressure, dropped below the crucial support at $102.8K as the escalating Middle East tensions triggered huge uncertainty within the markets. The recent air strikes by Israel on Iran have created geopolitical pressure, which has intensified the sell-offs. Meanwhile, the BTC price and the entire market have witnessed numerous pressures like these in the recent past and hence are believed to withstand the ongoing sell-off and turn out victorious soon.
The crypto markets witnessed over $1.1 billion in liquidations, while S&P 500 futures fell 1.9% and crude oil & Gold surged. Meanwhile, from the technical point of view, the BTC chart pattern shows some worrying patterns that point towards more downside. The token printed 3 consecutive daily bearish candles and wiped out the gains incurred earlier this week. With this, the token has reached a crucial level where a rebound could trigger a strong upswing, while a pullback could cause some concerns.
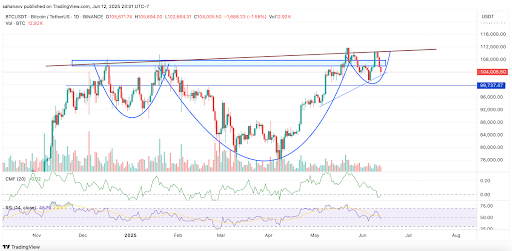
The daily chart of Bitcoin shows the formation of an inverse head and shoulder pattern, which is largely considered bullish. However, to validate the price, it is required to trigger a rebound from the lower support and rise along the curve to reach the neckline at around $110,500. If this happens, then the price is more likely to breach the neckline and form a new ATH. However, the technicians suggest a diverse price action showing the possibility of a pullback while the volume continues to drop.
The CMF has dropped below 0, suggesting an outflow of money or sell-off, while the RSI is maintaining a steep descending trend. With this, the RSI has reached the ascending support, and hence a drop below the levels could initiate a fresh bearish trend, leading the price lower. To prevent excess drain, probably close to $100K or below, a daily close above the current levels is required, which may hinder the momentum of bears and eventually offer room for a consolidated ascending trend.
Therefore, the upcoming weekly close could have a huge impact on the next Bitcoin (BTC) price rally.