Is RAY Price Up for Another Rally After a 600% Volume Surge?
Raydium is gaining renewed investor interest, all thanks to its strong fundamentals. As per recent stats, Raydium boasts a TVL of $1.86 billion and an impressive annual revenue of $655.9 million. What has caught the attention of many is that its capital efficiency metrics shine, it holds a Revenue/Market Cap ratio of 19.2% and TVL/Market Cap of 2.84x.
Moreover, with $67.2 million (11.9%) staked, investor conviction appears to be stout. As RAY’s price experiences a sharp intraday rebound, traders are closely watching to see whether this surge signals a broader recovery or short-term volatility. Join me as I derive the Raydium (RAY) price analysis for the near term.
RAY Price vs Volatility: Weekly Comparison
Recalling numbers from the recent past, as of April 30, 2025, RAY traded at $2.84 with a 1-week price volatility of 0.0609. Fast forward to today, that is, June 19, RAY’s current price stands at $2.27, with a 20% decline from the earlier high.
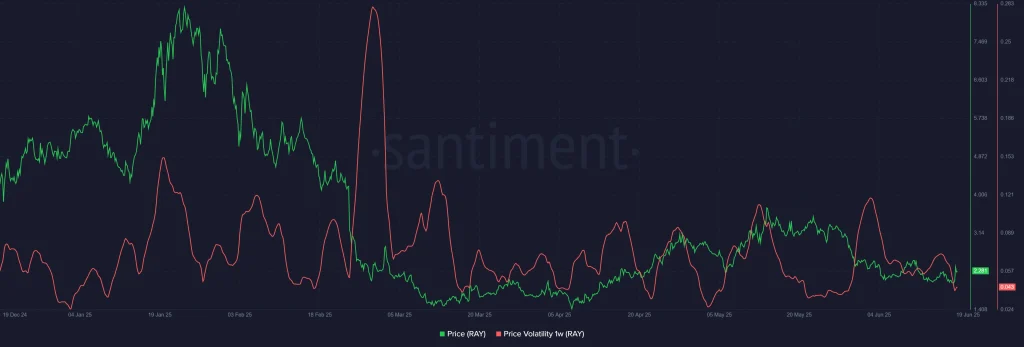
However, despite this drawdown, the token has stabilized and rebounded nearly 10% in the past 24 hours, while weekly gains sit at a modest +1.05%. Volatility seems to have compressed slightly, as reflected in the tighter Bollinger Bands on the chart. This indicates a reduction in price swings and a potential build-up for a new directional move.
RAY Price Analysis: Bullish Break or Temporary Spike?
RAY’s recent price surge has injected fresh momentum into its price structure. The 4-hour chart reveals a breakout above the midline of the Bollinger Bands in 20 SMA at $2.15, suggesting bullish sentiment is taking hold. Price action pushed through resistance at $2.10 and briefly tested $2.64 before pulling back.
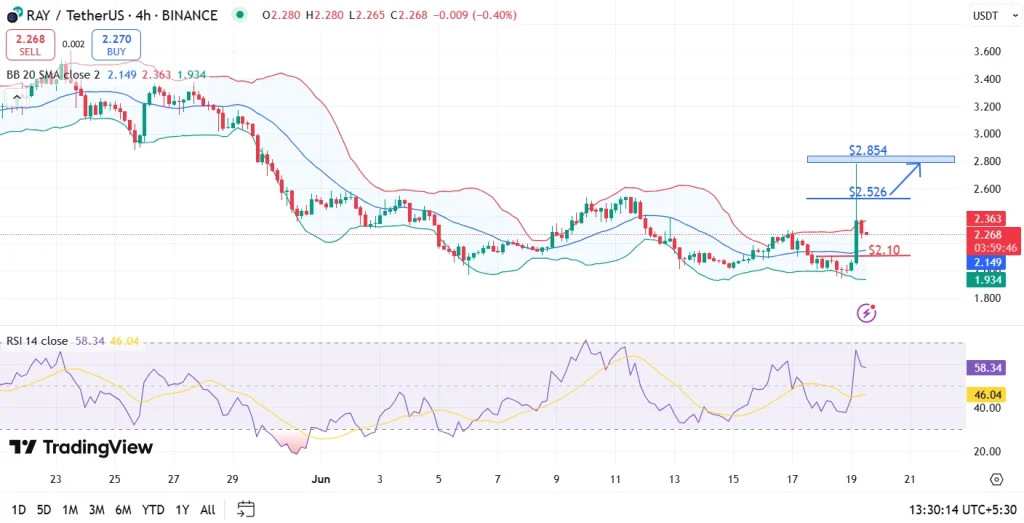
At present, the token is trading at $2.27, holding above key short-term support at $2.10. The 10% daily spike was catalysed by a 609% surge in intraday trading volume, which tallied to $401.19 million. A decisive breakout and close above $2.526 could pave the way for a further push toward the target at $2.854. The RSI stands at 58.34, hovering just below overbought territory, implying room for additional upside while still allowing caution for volatility.
Also read our Raydium (RAY) Price Prediction 2025, 2026-2030!