Stellar XLM Price on the Verge of a Breakdown, Should You Sell or Hold?
Stellar is facing one of its steepest corrections in weeks, plunging 10.84% in the last 24 hours to trade at $0.4168. This has come after logging a 7-day gain of over 12%, and eyeing a golden cross. Amid panic-driven activity, the trading volume surged 71.56% to $1.02 billion.
While XLM rallied earlier this month on optimism and stablecoin adoption news. The current breakdown below critical levels has been nerve-wrenching to hodlers. So, can the bulls hold the line at $0.40, or is a drop toward $0.33 inevitable? Join me as I decode the ins and outs of XLM in this analysis.
On-Chain Metrics Show Risk of Long Liquidations
According to the XLM Total Liquidations Chart by CoinGlass, July has seen a dramatic increase in liquidation between July 11–17. This is when short and long positions both saw spikes, suggesting heightened volatility. The latest surge in long liquidations near $0.40 indicates traders overleveraged during the July rally and are now being flushed out as the price slides.
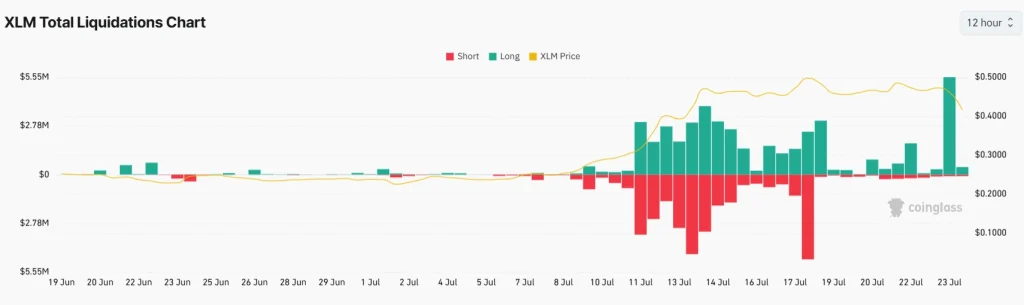
That being said, the fear of liquidation spikes mounts near the $0.40 zone. This is where over $79.8M in long positions are at risk compared to $42.1M in shorts. This, coupled with an 11.63% fall in open interest, shows many traders are now reducing exposure.
XLM Price Analysis:
Technically speaking, XLM’s structure has weakened after failing to hold above the 23.6% Fibonacci retracement at $0.44 and the 30-day EMA around $0.41. Currently trading at $0.4074, Stellar has dropped below the lower Bollinger Band, and the RSI has plunged to its oversold territory at 28.14.
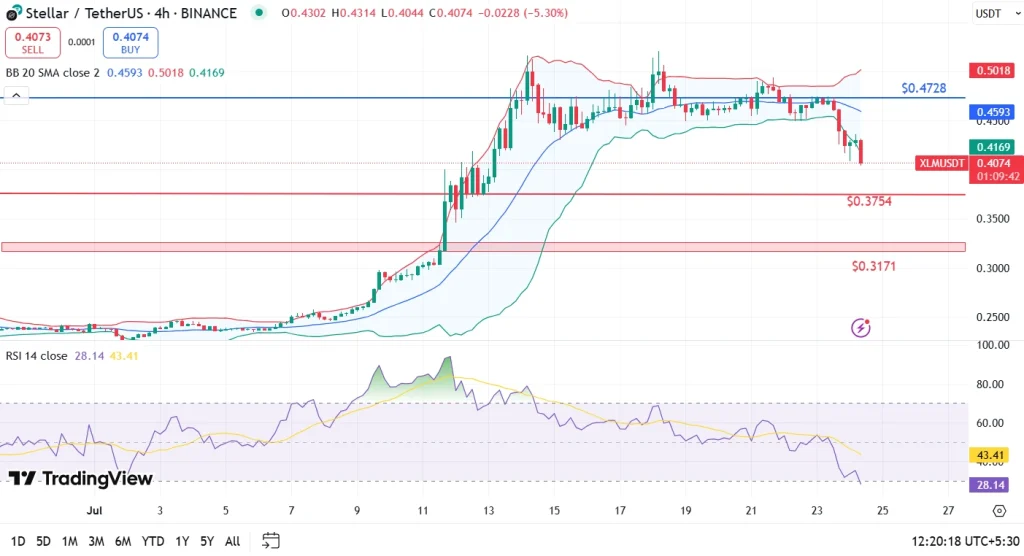
Support at $0.40 is now critical. If broken, the next key zone lies at $0.3171, which aligns with the 61.8% Fibonacci retracement from July’s rally. On the upside, bulls must reclaim the XLM price at $0.44 and $0.47 to reverse the downtrend.